


The Four Places Consumer Brand COGS Actually Leaks (and What Closes Each One)


Key Takeaways
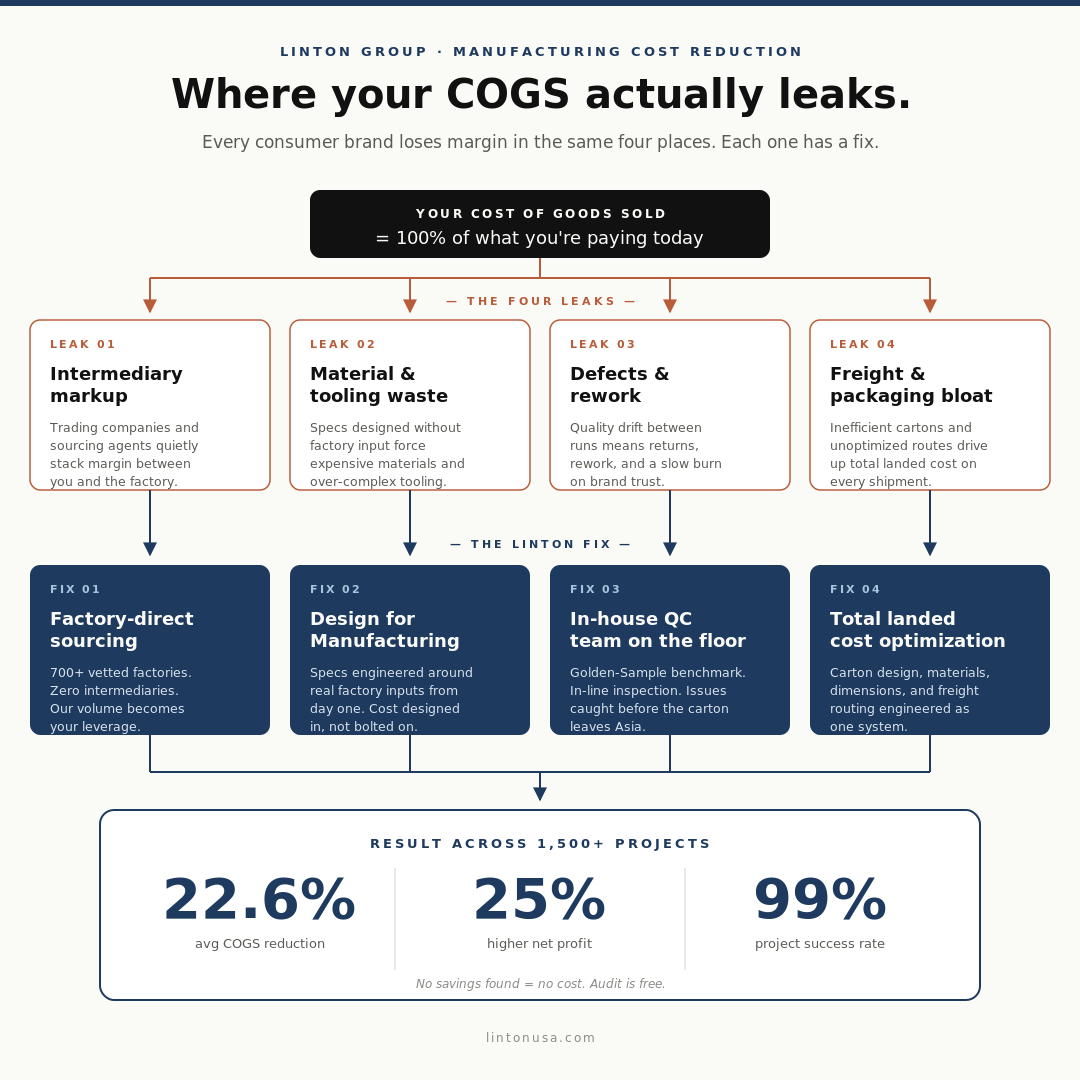
- Most consumer brand COGS erosion comes from the same four structural leaks, regardless of product category or production volume.
- The four leaks are intermediary markup, material and tooling waste, defects and rework, and freight and packaging bloat. Each absorbs measurable margin in nearly every overseas production setup.
- Brands cannot see these leaks because each one is owned by a different vendor in the production chain. No single vendor has both the data and the incentive to close them.
- Each leak has a specific operational fix. The savings are unlocked when all four are addressed together rather than in isolation.
- Across 1,500-plus Linton projects, the average COGS reduction once all four leaks are closed is 22.6%, with 25% higher net profit on optimized SKUs.
- The audit that identifies these leaks costs nothing. If no savings exist, the current manufacturing setup is confirmed as optimal.
Most consumer brands carry the same four leaks in their cost of goods, in roughly the same proportions, across roughly the same vendor relationships. The product category does not matter much. The production volume does not matter much. What matters is that the brand’s manufacturing chain was assembled from specialists — a design firm, an engineering consultant, a sourcing agent, a trading company, an overseas factory, a 3PL — and that each specialist is accountable only for their slice.
The leaks live in the gaps between those slices, where no single vendor has both the data and the incentive to close them. Across 1,500-plus projects, Linton has found that the same four leaks appear in nearly every consumer brand production setup, and that closing all four together delivers an average 22.6% reduction in cost of goods sold.
This article lays out the four leaks, explains why they persist even in well-run brands, and describes the specific operational fix for each. If your unit cost has drifted over the last 18 months and the cause is not obvious, schedule a consultation with the Linton team.
Explore Manufacturing Cost Reduction
Why Most Brands Cannot See These Leaks
The structure of the typical consumer brand supply chain hides the leaks rather than exposes them. A design firm produces a CAD package and hands it off. A sourcing agent introduces a factory and earns a finder’s fee. A trading company aggregates orders and takes a margin on top of factory pricing. The overseas factory produces to spec. A third-party QC firm inspects after the goods are packed. A 3PL handles freight and storage.
Each handoff is a clean transaction. Each vendor delivers what their contract specifies. The problem is that no vendor is looking at the total cost stack, and no vendor is accountable for the drift that accumulates between stages. Material specs that could have been simplified at the design stage become locked into tooling. Defects caught at the warehouse are too late to fix at the factory. Packaging that was acceptable for one freight class becomes the wrong dimension when freight rates shift.
The brand sees the symptom — gradually rising unit cost, compressed margin, customer complaints — without being able to point to a single decision that caused it. That is what happens to a cost structure that was never actually designed. It was assembled, piece by piece, by vendors who were each doing their job correctly.
Leak 01: Intermediary Markup
The first leak is the easiest to identify and the hardest to remove. Trading companies and sourcing agents sit between the brand and the factory, and in most overseas production arrangements they capture between 10 and 25 percent of the unit cost as margin. The brand often does not see this margin on any invoice because it is built into the per-unit price quoted by the intermediary.
This persists because intermediaries serve a real function. They handle translation, payment terms, factory communication, and order coordination that brands without overseas operations cannot easily replicate. The problem is not that the function is unnecessary. The problem is that the brand is paying a margin for a service that, executed through a different structure, costs a fraction of what an intermediary charges.
The fix is factory-direct sourcing. A brand that operates through a partner with direct factory relationships, in-market presence, and accumulated volume across many brands captures the same operational support that an intermediary provides, without the intermediary margin. Linton’s network of 700-plus vetted factories is structured so that production runs go through direct factory relationships, with Linton’s overseas field offices handling the day-to-day operational work that an intermediary would otherwise charge for.
The Aberdeen Oak bartender kit case study shows what this looks like in practice. By moving production from an intermediary-managed setup to a direct factory relationship through Linton’s network, the brand reduced unit cost from $15.75 to $12.74 — delivering more than $25,000 in savings on existing volume, without changing the product.
Leak 02: Material and Tooling Waste
The second leak begins at the design stage, long before the first purchase order is issued. Designs developed without factory input — by industrial design firms or in-house teams without manufacturing experience — routinely specify materials, tolerances, and assembly methods that the factory can produce but at a higher cost than necessary. Once the tooling is cut, those decisions are effectively permanent.
The pattern is consistent. A designer specifies a particular plastic grade because it matches a reference product, without knowing that the factory holds three other grades in stock at a lower unit price with equivalent performance. A part is designed with a tight tolerance that requires secondary machining, when a looser tolerance with a different geometry would have met the functional requirement at half the labor cost. A multi-part assembly is specified that could be consolidated into a single molded piece with a marginally different tooling investment and a meaningfully lower per-unit cost.
These are not design failures. They are integration failures, and they happen because the design step and the manufacturing step are owned by different vendors with no shared accountability.
The fix is Design for Manufacturing built into the design stage, not bolted on after. Linton’s product design and development program evaluates manufacturing feasibility, material substitution opportunities, and tooling strategy as part of the design process. The phase Linton calls “pressure testing” surfaces these decisions before money is spent on prototypes or tooling, when the cost of changing them is still measured in design hours rather than mold revisions.
When DFM is integrated upfront, the unit cost embedded in the design is closer to factory floor reality from day one. Brands that rebuild an existing product line with DFM applied retroactively typically recover several percentage points of unit cost on top of whatever the other three leaks contribute.
Leak 03: Defects and Rework
The third leak compounds quietly. A 3 percent defect rate at 1,000 units is a manageable nuisance. The same 3 percent rate at 50,000 units, factoring in returns, replacements, lost reviews, and the operational time spent managing supplier disputes, becomes a serious margin problem. And the defect rate rarely stays flat over time. Without an enforced production standard, quality drifts between runs, often slowly enough that the brand does not notice until customer complaints reach a threshold.
The structural reason defects persist is that quality control is usually outsourced and after-the-fact. A third-party inspection firm visits the factory before shipment and pulls a sample. By the time the inspection happens, the production decisions that caused the defects have already been made and locked in for the entire run. The brand either accepts the goods with known issues or absorbs the cost and timeline of rework.
In-line QC catches issues at the production stage where they can still be corrected. The defect is identified at the line, the cause is traced — often a material substitution, a worn tooling component, or an assembly station drifting out of spec — and the correction happens before the next thousand units are produced. This is the difference between managing quality and inspecting it.
The fix is in-house QC on the factory floor, running to a defined standard. Linton’s QC team operates against ANSI/ASQ Z1.4 2018 as a quantifiable inspection benchmark, with field presence near the supplier clusters they support. The Golden Sample approved at the end of prototyping becomes the production reference, and inspections measure against it at every stage of production.
The CRBN Pickleball Pro Team Tour Bag case study illustrates the compounded impact. By transitioning suppliers and reinforcing the bag’s internal construction under in-house QC oversight, Linton reduced COGS by 19.67 percent on the brand’s best-selling SKU while improving product reliability — the kind of result that closes both a margin leak and a brand-trust leak at the same time.
Leak 04: Freight and Packaging Bloat
The fourth leak hides inside what most brands treat as a fixed cost. Carton dimensions, master pack configurations, packaging materials, shipping routes, and freight class assignments are usually set during the initial production run and rarely revisited. When freight rates shift, when FBA dimensional rules change, when a new tariff classification becomes available, the brand’s landed cost rises silently while the unit cost on the factory invoice stays the same.
The cost is real and often substantial. A carton that is 10 percent larger than it needs to be ships at a higher dimensional weight on every container, for every reorder, for the life of the product. Packaging materials specified for a higher protection class than the product actually requires add per-unit cost on every run. A shipping route that was optimal two years ago may now be 8 percent more expensive than an alternative the freight forwarder has not flagged.
The leak persists because freight and packaging are typically owned by a 3PL or freight forwarder whose incentive is reliability, not cost optimization. The brand pays the bill without anyone in the chain whose job is to ask whether the bill is the right size.
The fix is total landed cost optimization treated as an ongoing discipline. Linton’s approach evaluates carton design, packaging materials, product dimensions, HTS classification, tariff exposure, and freight routing as one system tied to unit economics. This often surfaces multi-percentage-point savings on existing SKUs without changing the product itself, and it ensures that new product launches build the right landed cost into the design from the beginning rather than discovering it on the freight invoice three runs in.
Why the Four Fixes Have to Work Together
Each fix on its own delivers measurable savings. Factory-direct sourcing without DFM still leaves design-stage cost embedded in the tooling. DFM without in-line QC still allows quality drift to erode margin. In-line QC without freight optimization still leaves landed cost higher than it should be.
The 22.6 percent average COGS reduction Linton delivers across 1,500-plus projects reflects what happens when all four leaks are addressed together as an integrated program, not as separate engagements with separate vendors. Each fix protects the value of the others. Factory-direct relationships make in-house QC enforceable. DFM makes factory-direct pricing more meaningful. Landed cost engineering ensures that the savings captured upstream are not lost downstream.
This is the structural reason that piecemeal cost reduction efforts underperform. A brand that hires a sourcing consultant to renegotiate factory pricing, then a QC firm to tighten inspections, then a freight broker to find better routes, ends up with four contracts and three handoffs, each of which introduces the same kind of gap that caused the original leaks. The savings get partially captured, then partially leaked back out through the gaps between the new vendors.
The same principle applies to brands managing overseas production directly. Linton has covered why most overseas manufacturing failures are management failures rather than factory failures in a separate article on the real pros and cons of overseas manufacturing. The four-leak pattern is a specific case of that broader observation: the leaks are not caused by bad factories or bad designers or bad freight forwarders. They are caused by the absence of a single owner accountable for the total cost stack.
What a Linton Cost Audit Actually Looks At
Linton’s manufacturing cost reduction program begins with a free audit that evaluates all four leaks against the brand’s actual purchase orders, BOMs, supplier agreements, and shipping data. The audit produces a written savings proposal with projected unit cost reduction, the specific operational changes required, and the expected timeline to realize the savings.
If the audit finds no savings, the brand pays nothing and walks away with confirmation that the current manufacturing setup is already optimal. If savings exist, Linton manages the execution end-to-end: factory transition where required, sample matching to validate the new production setup, in-house QC during the transition, and logistics coordination through the first full production cycle on the new terms.
The audit is structured this way for a specific reason. Most brands carry at least one of the four leaks at material scale, and most do not know which one is largest until the data is in front of them. A no-cost audit removes the financial barrier to finding out. Across the brands Linton has audited, the project success rate is 99 percent, and the average improvement in net profit on optimized SKUs is 25 percent.
When to Engage on Cost Reduction
The right time to address these leaks is before they compound. A brand running at 50,000 annual units with a 3 percent margin gap will absorb roughly the same total leak as a brand running at 10,000 units with a 15 percent gap, but the larger brand will discover the leak later and find it harder to fix without disrupting active production.
For brands with rising unit costs, compressed margins, or persistent quality complaints, the audit is the fastest way to identify what is driving the problem. For brands launching new products, building the four fixes into the development process from the beginning prevents the leaks from forming at all. Linton’s product design and development program is structured to embed DFM, factory-direct sourcing, in-house QC, and landed cost engineering into the design and prototyping phases, so the product reaches mass production with the right unit economics from the first run rather than discovering them after the fact.
If your COGS has drifted over the last 18 months and you cannot pinpoint why, the answer is almost always one or more of these four leaks. Schedule a consultation with the Linton team, or learn more about how Linton operates across U.S. and Asia field offices on the About Linton page.
Alex Einhorn
Dir of Sales | Linton Group
Alex is Director of Sales & Marketing at Linton Group, where he helps e-commerce brands build better products, improve quality, and stop overpaying for manufacturing. He works directly with founders to cut unnecessary costs, fix inefficient supply chains, and turn ideas into scalable, profitable products. His approach is simple: develop quality products that earn real brand trust, not just transactions.
View Author PageWondering if your product could be built better, faster, or at a lower cost?
Related Posts

Most carbon fiber products start as a conviction. A brand knows their paddle should hit harder, their racket should feel more stable through contact, or their part should be lighter without giving up stiffness. The physics says carbon fiber can do it. The renderings look right. The first hand-built sample even feels right. Then the […]
Read More
White label vs private label manufacturing is a comparison that trips up more consumer brands than most people admit. Both models move product. Both allow brands to avoid building their own factories. But they lead to very different outcomes as brands scale. With experience developing 1,200+ products across 200+ categories, Linton has seen exactly where […]
Read More
Most consumer product mistakes do not happen at the factory. They happen before the factory is ever contacted, in the gap between a product concept and a manufacturing-ready design. With 1,200+ products developed across 200+ categories and a 99% project success rate, Linton has seen what separates products that scale cleanly from those that generate […]
Read More